Data Tree
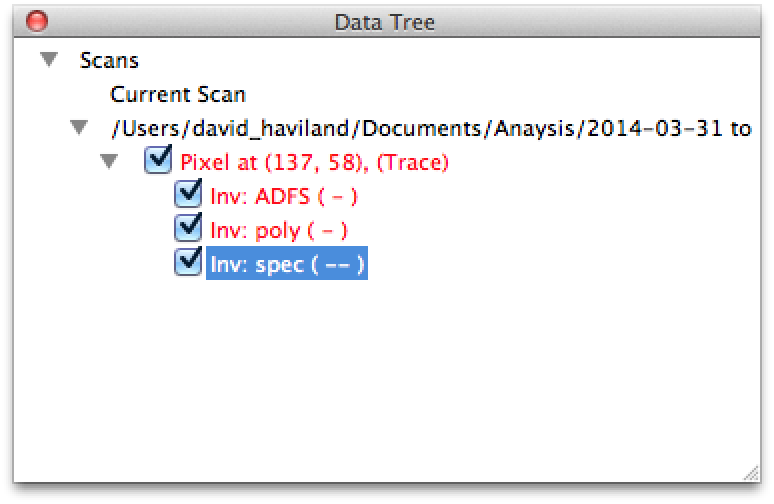
The Data Tree panel is available from the Advanced pull-down menu. The panel can be docked in either the scanning view or the analysis view, or both. This panel lists scans which are open in the analysis panel as well as the current scan. Under each scan there is a list of all the pixels which have been selected with the Pixel inspector tool. The color of the text for each pixel corresponds to the color of the cross marking the pixel in the image. Under each pixel there is a list of the different force reconstructions done on that pixel.
Right click on a scan file name and select:
Open shell here...to open a Python shell with an object calledimagecontaining all the data stored in this scan file. The data id of the scan used by the data tree is given, along with a couple of useful commands. The shell is for advanced users who will need the developer documentation to use this feature effectively.Show meta datato open a box to view the calibration data stored with this scan file (i.e. the Current calibration at the time that the data file was closed) as well as a time and frequency domain plot of theFreeandLfitedmotion.
Save as ascii...to open a dialog box where you can save all amplitude and phase data in ASCII format. The save will create individual files in a new, empty folder. There will be one file for both amplitude and phase at each of the measured frequencies, both trace and retrace. For example, when 32 frequencies are measured, 128 data files will be created. If the image is 256 x 256 pixels, this corresponds to about 140Mbytes of data in tab-delimited text, with a carriage return at the end of each scan line.
The name of each file begins with a number which codes for the frequency. The number corresponds to the index of the ‘k-array’ which stores the integers multiples of
which give the frequency values where amplitude and phase is measured (see Intermodulation Measurement). In the folder there is also a file called metadata.txt which contains a list of integers in the array LO_IMP_KARRAY. The number at the beginning of each file corresponds to the index of this array (zero being the first element). The integer values stored in this array, times LO_DELTA_F, gives the frequency at which the amplitude and phase is measured.
Save as imp...to open a dialog box where you can resave the entire scan file with all meta data to a new .imp file. This is usefull when you make changes to the scan data, for example if you redefine the lift oscillation (see below).
Right click on a pixel or patch and select:
Open shell here...to open a Python shell with an object calledpixelcontaining the data relevant to this pixel. The data id used by the data tree is given, along with a couple of useful commands. The shell is for advanced users who will need the developer documentation to use this feature effectively.Deleteremoves the pixel from the data tree. The cross will also be removed from the image, and the plots from the Fore Inspector panel. You can also remove any pixel by right-clicking close to that pixel in the image when the Pixel inspector tool is selected.Save time data to text fileto export the cantilever deflection vs. time during the time window for this pixel. This data is is actually the inverse FFT of the spectral data taken by the MLA™, with some zero padding to give appropriate sampling in the time domain.Save spectrum data to text fileto export create the raw spectral data measured by the MLA™ at this pixel.Save FI FQ data to text fileto export the FI(A) and FQ(A) data for this pixel (see Dynamic force quadratures).Redefine as lift oscillationis very usefull if you have a file with a pixel, or group of pixels (patch) selected with the Area inspector tool, where the cantelever has lost contact with the surface. This ‘parachuting’ pixel or patch can be used to redefine the just-lift oscillation in the .imp file (see Measure just lifted). Note that the redefinition is only valid in the loaded scan data. It is not saved to disk unless you actively save a new version of the .imp file.
The check-boxes at each pixel and each force reconstruction controls plotting. Un-check to remove the cross from the image or plot from the Force Inspector panel, without actually removing the data from the data tree. Checking the box will show the plots again.
Pixels selected in the current scan will not be removed when a new scan is generated. When the scan moves passed a selected pixel, the image no longer corresponds to the selected pixel. Selected pixels must be removed manually in the current scan.
Clear All in the Force Inspector panel removes all selected pixels in all scans.
Right click on a force reconstruction and select:
Open shell here...to open a python shell with an object calledforcecontaining the result of the force reconstruction at this pixel. The data id used by the data tree is given, along with a couple of useful commands. The shell is for advanced users who will need the developer documentation to use this feature effectively.Get fitted parametersto open a dialog box showing the fitted parameters when the Model Fit method is used.Save Data to text fileto export the force curve found using that reconstruction method.