- Technical Notes
- Manuals
- Spec Sheets
- Brochures
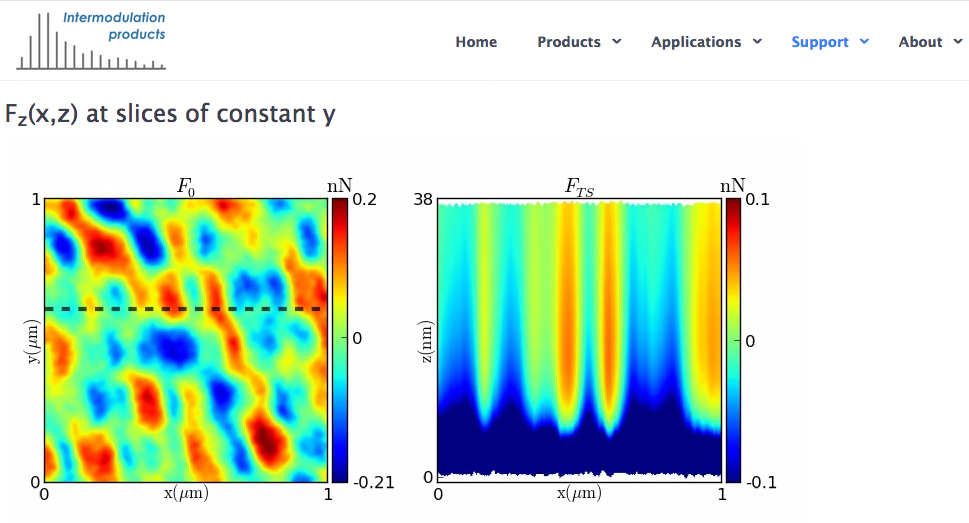
- Force-volume reconstruction
- ImAFM spectra on approach
- ImAFM overview
ERROR: modular/modular.html.twig template not found for page: /resources/_tutorials
Tutorials
ERROR: modular/default_subpage.html.twig template not found for page: /resources/_videos
Videos
ImAFM approach curve
In this experiment a cantilever is driven by two closely-spaced tones centered on resonance. The response in the frequency domain is shown in the upper left. In the time domain, shown in the lower left, we have a beating waveform or rapid oscillation with a slow modulation envelope. At the start of the video, the cantilever is freely oscillating above the surface and the cantilever only responds at the two drive frequencies (linear response). As the surface is approached, the nonlinear tip-surface interaction results in many intermodulation products (IMPs) of the two drive tones. The upper right panel tracks how these IMP's change with approach distance. The frequency comb of IMP's is the Fourier transform of the time signal or the distorted beat. Only amplitude is plotted, but phase is also measured at each frequency.
Force-volume reconstruction
ImAFM can be used to reconstruct force-volume maps, or the vertical component of the tip-surface force FTS(x,y,z). These two videos displays the result of such a reconstruction by scanning a slice through the three-dimensional data set. The sample was a hard disk and Intermodulation Magnetic Force Microscopy (ImMFM) was used to extract the long-range magnetic forces. One can see that very close to the surface, the magnetic force pattern becomes hidden by the much larger surface forces.